Architects are increasingly looking to design buildings that have good daylighting, low energy use, and have low operating costs. But how are these factors measured? Here are six performance metrics that every architect should know — and how to use them in your projects.
Jump to:
1. EUI (Energy Use Intensity)
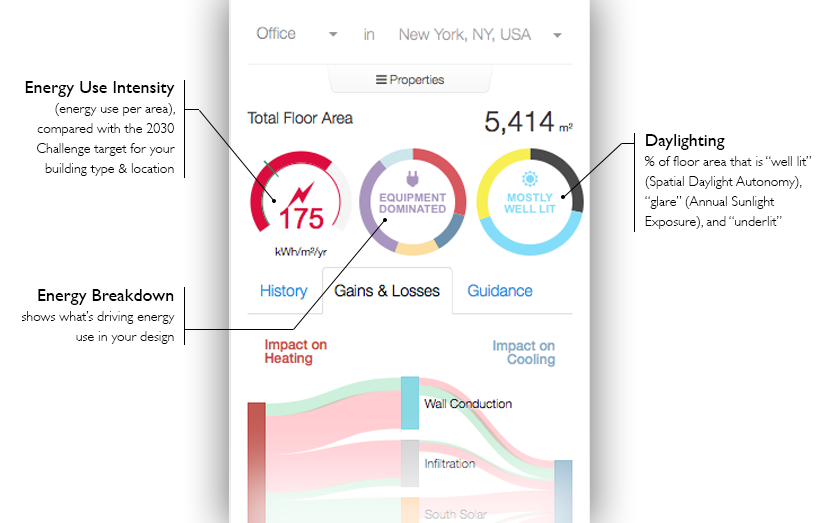
Definition: Energy Use Intensity is a building’s annual energy use per unit area. It is typically measured in thousands of BTU per square foot per year (kBTU/ft2/yr) or kWh/m2/yr. EUI can measure “site” energy use (what the building consumes) or “source” energy use (the amount of fuel the power plant burns to produce that much energy). Unless otherwise specified, EUI typically refers to “site” energy use.
EUI is useful for comparing performance of buildings across sizes, types, and locations. It can help you design buildings with low energy use, and, as a likely result, lower operating costs. It is used by programs like ENERGY STAR and the 2030 Challenge, which have specific EUI goals for different building types. It is also being used to benchmark buildings for public reporting in many cities.
Typical values: Below are some average EUIs for three building types in the US. (These are meant to give a rough idea of EUI ranges; actual values can vary widely based upon location & specific space uses.)
Office
Source EUI (power plant’s energy consumption): 148kBTU/ft2/yr (467 kWh/m2/yr)
Building energy consumption: 67kBTU/ft2/yr (211kWh/m2/yr)
2030 Challenge target (60% reduction, site EUI): 27kBTU/ft2/yr (85kWh/m2/yr)
K-12 Education
Source EUI (power plant’s energy consumption): 141 kBTU/ft2/yr (445 kWh/m2/yr)
Building energy consumption: 58kBTU/ft2/yr (183 kWh/m2/yr)
2030 Challenge target (60% reduction, site EUI): 23kBTU/ft2/yr (73 kWh/m2/yr)
Single-family residence
Source EUI (power plant’s energy consumption): 68 kBTU/ft2/yr (215 kWh/m2/yr)
Building energy consumption: 46kBTU/ft2/yr (145 kWh/m2/yr)
2030 Challenge target (60% reduction, site EUI): 18 kBTU/ft2/yr (57 kWh/m2/yr)
How to use it: Use EUI to set targets for your design. Use it while you design to understand whether the building’s performance is good or bad (relative to your target, or to other similar buildings). To reduce EUI you will need to dive deeper into the energy use data to determine what’s driving energy use. Find out how Sefaira can help you create building performance analysis in minutes.
2. Annual Carbon Emissions
Definition: Annual Carbon Emissions measure the carbon emissions associated with a building’s energy consumption. To calculate carbon, we have to follow the energy back to where it was produced. This means that the carbon intensity of electricity depends on the mix of power sources in a region. Other (non-carbon) greenhouse gasses (e.g., methane) are assigned a standard carbon equivalency, so the end result is in terms of carbon.
Why it’s important: Reducing carbon emissions is vital for mitigating global climate change. For this reason, some codes and standards use a Zero Carbon metric, rather than a zero energy metric.
How to use it: You can use carbon emissions in a similar way to EUI — to get a quick idea of how design options compare to one another. Dig in further to understand biggest contributors. Remember that different energy sources (fuel oil vs. electricity) have different carbon intensities — which means that energy and carbon don’t always move in parallel.
3. Spatial Daylight Autonomy (sDA)
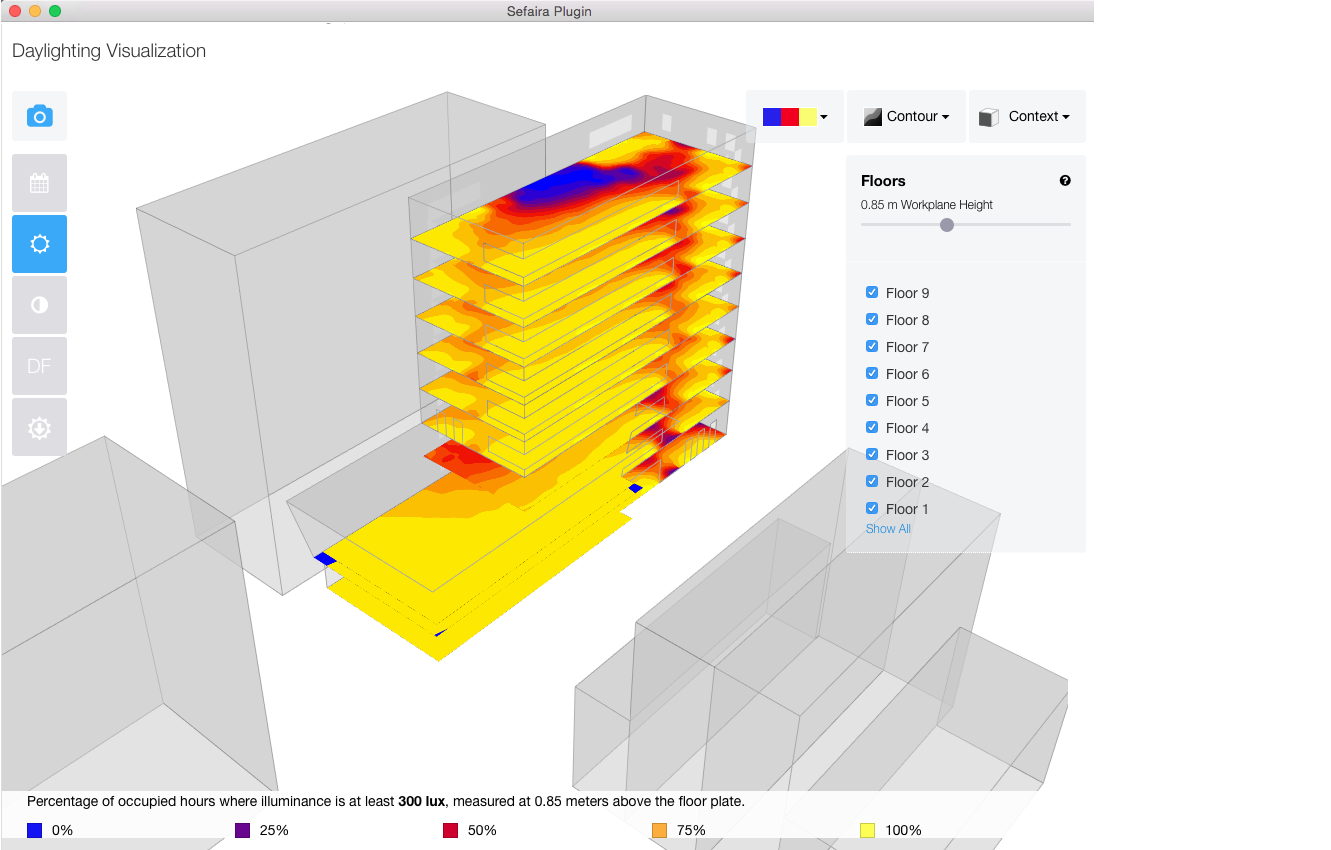
Definition: Spatial Daylight Autonomy (sDA) describes how much of a space receives sufficient daylight. Specifically, it describes the percentage of floor area that receives a minimum illumination level for a minimum percentage of annual occupied hours — for instance, the area that receives at least 300 lux for at least 50% of occupied hours (which would be notated as sDA300/50%). It is a climate-based daylighting metric, meaning that it is simulated using a location-specific weather file (similar to an energy model).
Why it’s important: Simulated sDA can help you design buildings that have good daylighting, as sDA has been shown to be a good predictor of actual as-built daylight performance. It is used in one of the compliance pathways for daylight credits in LEED v4.
Typical values: LEED v4 awards points for sDA300/50% of 55% and 75% for regularly occupied floor area. (In other words, at least 55% of regularly occupied floor area receives a minimum of 300 lux for at least 50% of occupied hours.)
How to use it: sDA can provide quick snapshot of how well daylit your design is. Use it to find the right amount and location of glazing in your building, the best floor-to-floor heights, and best floorplate depths. Use sDA in combination with ASE to make sure that you don’t have too much direct sunlight. (Good daylight can also reduce your energy use: read our post on Daylight and Energy to see how.)
Daylight Autonomy can also be visualized on a building’s floorplate, which can help you identify which areas are not receiving enough daylight.
4. Annual Sunlight Exposure (ASE)
Annual Sun Exposure (ASE) describes how much of space receives too much direct sunlight, which can cause visual discomfort (glare) or thermal discomfort. Specifically, ASE measures the percentage of floor area that receives at least 1000 lux for at least 250 occupied hours per year (ASE1000,250).
Why it’s important: ASE is an indicator of possible glare or thermal comfort issues. However, it doesn’t directly measure glare or thermal comfort, but rather direct sunlight. ASE is used alongside sDA in LEED v4.
LEED v4 awards points for daylight only when ASE is 10% or less for regularly occupied floor area. (The author’s own experience indicates that this may be a difficult number to achieve, and may not be ideal in some cases — for instance, for passive solar designs that rely on direct solar gain during winter months.)
How to use it: Use ASE as an early indicator of whether there is too much direct sunlight in your design. To reduce ASE, consider adding shading devices to windows, reducing visible transmittance (T-viz) of glazing, or moving glazing to facades that receive less direct sunlight. Use PreDesign to quickly work through performance outcomes for different shading options.
5. Annual Operating Cost
Definition: The annual utility costs incurred for operating a building (electricity + fuel + water)
Why it’s important: Many building owners are looking to reduce operating cost. This metric is also important for evaluating payback period of energy efficiency measures, as well as calculating ROI and Life Cycle Cost (LCC).
Typical values: The average utility costs for most commercial buildings in the US is between $2.25 and $3.00 per sq.ft. per year.
How it use it: Look at operating cost to demonstrate the benefits of different design options and optimizations. Sefaira customers can use Response Curves to identify strategies that minimize operating cost. Remember that energy and cost don’t always move in parallel, because different energy sources have different costs (e.g., fuel oil vs. electricity).
6. Peak Heating / Cooling Load
Definition: A heating or cooling load is the amount of heat that needs to be added to or removed from a space to maintain the desired temperature. The “peak load” is the worst hour over the span of a year — so, a building’s “peak heating load” is the largest amount of heat that needs to be added to a space in a single hour.
Why it’s important: HVAC systems are typically sized to meet peak loads. Reducing peak loads means a smaller, less expensive HVAC system, more leasable square footage, and more options when it comes to system selection. Reducing the size and cost of HVAC systems is a key strategy for achieving deep energy reductions with favorable payback, or with no cost premium at all.
Typical values: A typical rule of thumb for cooling loads is 300 ft2 per ton of cooling (for most of the US) for cooling loads. For example, a 120,000 ft2 office building would require approximately 400 tons of cooling (120,000ft2 / 300ft2 per ton).
How to use it: Use peak loads as an early proxy for system size and cost. Look at how passive design strategies (e.g. shading devices) can reduce peak loads. This metric also represents a good opportunity for early collaboration with the project’s engineers.
Sustainable building design is the way of the future. SketchUp is here to help you build better buildings based on the best information available. If you aren’t a current subscriber, try it out using our free trial.